
Table of contents
Profiling is one of the crucial speed optimization techniques in Magento 2. When enabled, the built-in profiler in Magento (MAGENTO_PROFILER) will give you various benefits such as:
- Dedicated performance report : automatically generate a report of your store’s performance. The report includes various timers involved in the process of rendering your storefront, such as
cache_frontend_create,cache_load, etc - Dependency graphs: additionally, you also have the option to enable dependency graphs when configuring
MAGENTO_PROFILER. A dependency graph shows a list of various object dependencies used within your store, and by this way, you can know which are the unused dependencies within your store—and consequently, where are your wasted processor time and wasted memory
How to Enable Profiler in Magento 2
There are various ways you can use to enable profiler for your Magento 2 store. Below we’ll go through each one of them.
By adding an environment variable (Apache only)
If your Magento instance runs on an Apache server, editing the .htaccess file is a quick way to enable Magento profiler.
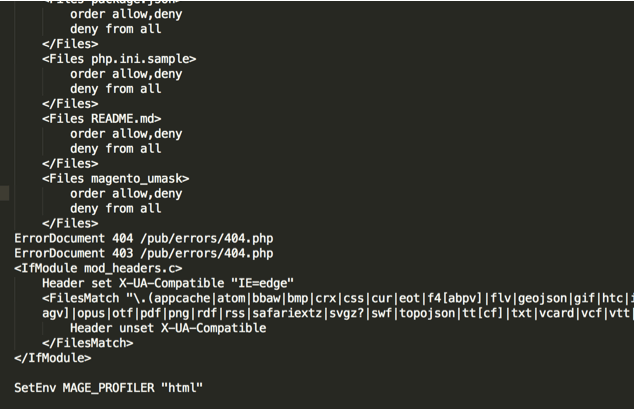
Step 1: Add this following code in .htaccess file at Magento root directory:
# SetEnv MAGE_PROFILER html
Step 2: Set the value of MAGE_PROFILER to the following:
csvfile: reports are stored in/var/log/profiler.csvhtml: results in blocks of html code at the end of your store’s homepagefirebug: reports are stored in/var/log/profiler.csvusing Firebug output
Step 2: Enable Magento 2 Developer mode using Command:
php bin/magento dev:profiler:enable <type>
With CLI commands
Step 1: Enable profiler using the following command:
php bin/magento dev:profiler:enable <output_type>
You can choose from two built-in output types which are: html and csvfile. When no output type is specified, the profiler will default to html.
Step 2: Finally, refresh the cache using:
php bin/magento indexer:reindex
Check your reports
Depending on your configuration, you’ll see the result as below:
You’ll see the result as below:
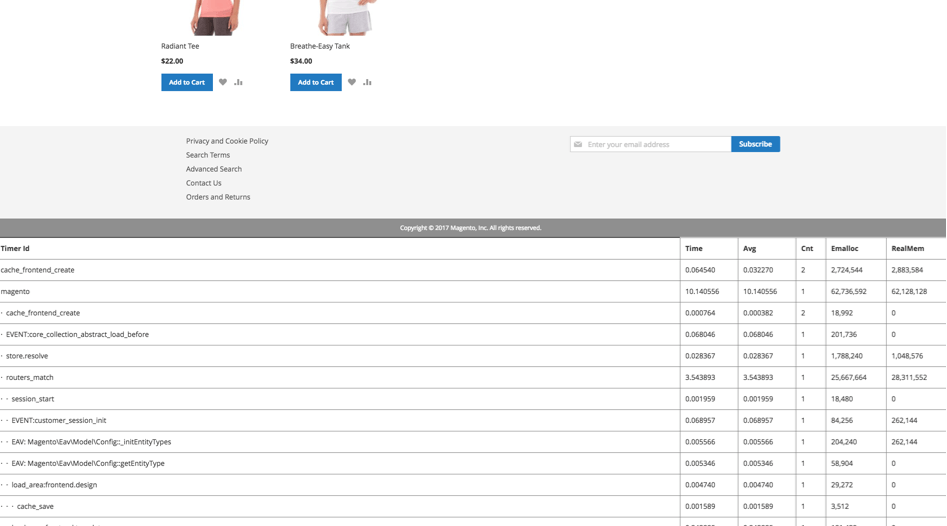
- In HTML Profiler: the profiling should be located below the footer section of your storefront. Open your homepage and scroll down, you should see a list of timers_id and the time it takes to execute each timer like so:
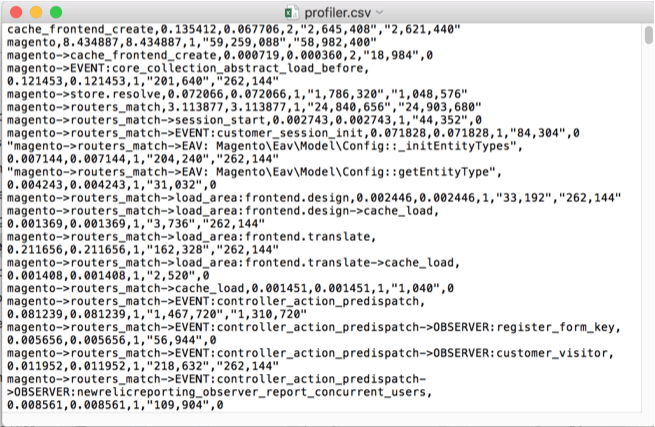
- CSV File: a Profiler.CSV file would be created in the
var/logdirectory.
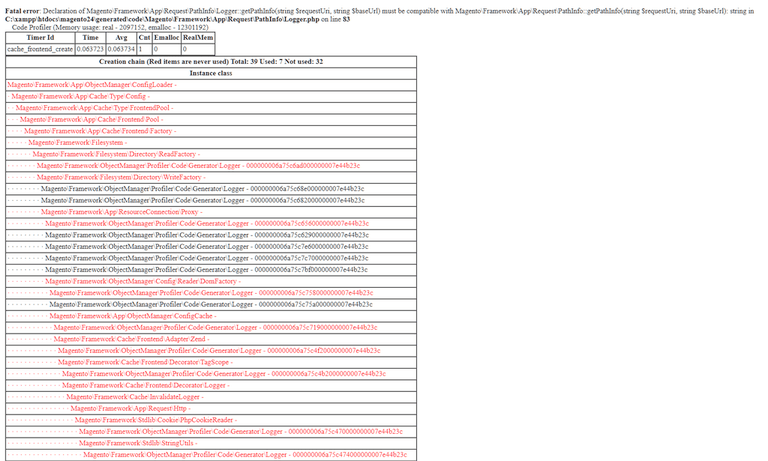
Dependency graphs: If 2 is set as the value for your MAGE_PROFILER in your .htaccess file, you should see the following page when trying to access your storefront:
After finishing Profiler configuration in Magento 2, you can now easily spot the points slowing down your system!
Hope this helps!


