
Table of contents
The last few years were a time when the mobile commerce (mcommerce OR m-commerce) industry witnessed a kind of unprecedented growth. According to App Annie’s State of Mobile 2019 report, the total time mobile users spent in shopping apps was 18 billion hours in 2018 [1]; and Cyber Monday alone generated $2 billion dollars [2], over half of which came from mobile devices. These are all promising statistics that might nudge your business in a more proper direction, and there’s plenty more where that came from:
M-commerce General Statistics
- 79% of smartphone users have made a purchase online using their mobile devices in the last 6 months.
- 51% of Americans downloaded at least one shopping app to their smartphone at the peak of the COVID-19 pandemic.
- 21% of device users access retail shopping apps multiple times a day, and 35% access them multiple times a week.
- 49% of Americans have used a shopping app to compare prices.
- 77% of US adults own a smartphone and 53% own a tablet, showcasing the number of potential mCommerce customers.
Statistics of Mobile Payments
- The mobile payment market is projected to hit $4.574 billion by 2023, which is a 33.8% compounded annual growth rate compared to 2017 [7]
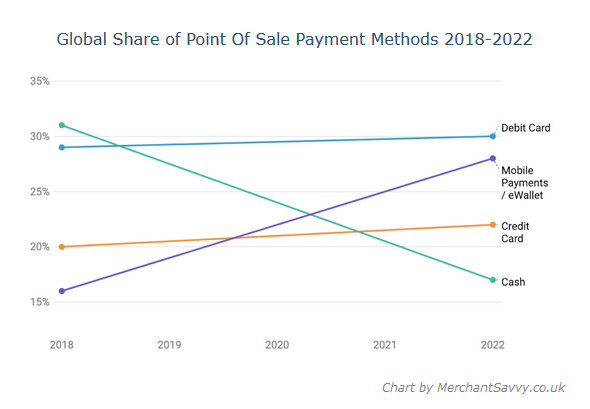
- According to Worldpay’s 2018 Global Payment Report the use of mobile payments is set to continue its inexorable rise and become the second most common payment method after debit cards by 2022. [8]
- As more mobile payment applications (e.g., Paypal, Apple Pay, Amazon Pay, etc) are used to accept payments, the use of mobile payments is set to continue its unstoppable growth of 26.93% between 2020 – 2025 [9]
Proximity mobile payments such as NFC payments, QR codes, etc are gaining popularity. The outbreak of Covid19 pandemic makes these types of contactless payment methods even more prominent.
- As MasterCard revealed in their survey, 79% of their global customers purchase with contactless payments for sanitary and safety purposes, and this continues to be a new norm post-pandemic. [10]
- There will be 1.31 billion global users who use mobile phones to make these types of transactions by 2023. [11]
- Insider intelligence suggests by the end of 2022, 46.8% of smartphone users will use proximity mobile payment. [12]
- Mobile wallet’s market size is expected to reach a CACR (Compound Annual Growth Rate) of 28.2% during 6 years from 2021 to 2027 [13] and is set to reach $US 750.3 billion by 2028 [14]. Merchant Machine predicts that there will be 4 billions of mobile wallet users by 2024
In terms of pure user numbers, Chinese tech firms are dominating the world with Alipay and WeChat, followed by which are Apple Pay and PayPal.
| Company | Active users | Latest figures from |
| Alipay | 1.3 billion | Alipay (Q1 2022) |
| 1.27 billion | China Internet Watch (Q4 2021) | |
| Apple Pay | 507 million | Fortunly (2020) |
| PayPal | 429 million | Statista (Q1 2022) |
| Samsung Pay | 51 million | Juniper (2018) |
| Amazon Pay | 50 million | Evercore ISI, Investopedia (May 2018) |
| Google Pay | 39 million | Juniper (2018) |
In the US market only, Apple Pay remains the most popular payment app, which is followed by Starbucks, Google Pay & Samsung Pay [15]. Moreover, during the pandemic, more than half (51%) of Americans turned to contactless payments [16], while in 2016, 80% of consumers in the US have never used a tap-to-pay method [17].
Mobile payment is expected to replace credit and debit cards after decades of being the preferred method. This, of course, shouldn’t come as a surprise for you since mobile payment has the advantages of being quick, wireless and effortless. For modern customers, all you’d ever need to carry along with you is a smartphone with 3G/4G connection and you’re good to go.
Statistics of mCommerce Retail
- By 2024, the number of mobile shoppers in the US is expected to exceed 187 million [18]
- In the US retail market only, Mobile Commerce is predicted to generate 710.42 billion sales in 2025 from 431.4 billion in 2022 [19].
- eMarketer estimates that the global retail M-Commerce sales will hit $4.5 trillion, which make ups 69.9% of overall retail eCommerce sales.[20]
The mCommerce world is growing at such a rate that’s never been seen before. Marketers are now expecting mCommerce to be the main channel for online shopping since as much as 87% of shoppers engage in online product search before buying.
Statistics of App Users Patterns
- 67% of consumers have downloaded a retailer app. [21]
- 71% of in-store shoppers who use smartphones for online research say their device has become more important to their in-store experience. [22]
- When buying in store, 61% of buyers in the US use mobile phones. 55% of them use smartphones to compare prices, 46% sign up for discount codes and 44% check product reviews. [23]
- 41% of customers do not mind having their purchase history used for personalized SMS offers, while 76% of brands loyal fans want to get updates personalized for them via SMS.[24]
- 67% of customers who do window-shop online does it just for fun, with 77% of those end up making impulse purchases in the end. [25]
As mCommerce grows in its market share, it’s becoming increasingly important for eCommerce store owners to make their store responsive to all kinds of screens and devices. And while smartphones are becoming the main devices for browsing products, it’s still not delivering an adequate conversion rate compared to tablets and desktops.
Statistics of Mobile Search
- Mobile is the dominant platform for searches with 48% of buyers using a smartphone to start searching with a search engine. [26]
- 58% of Google searches are done via mobile devices. Only 5 years ago, the figure was nearly half of that (34%). [27]
- 65% of clicks on paid Google search results come from mobile devices. [28]
- 42% of mobile-driven brand interactions involve Google search. [29]
- 88% of consumers who search for a type of local business on a mobile device call or go to that business within 24 hours. [30]
- 60% of consumers use social media to research new products and services. [31]
It is expected for mobile searches to stay relevant for quite a while since the world is demanding a need for convenience that desktops and bigger types of devices can’t meet. In Q2 of 2022, mobile devices made up 58.99% of global web traffic. This means that the majority of your customers are now mobile-based, and thus, to drive your mCommerce success, it’s important that you understand and master mobile SEO practices for an easier time of getting on top of Google SERP. [32]
Statistics on latest M-Commerce trends
Social commerce, which refers to selling via social network channels such as Facebook, Instagram or Tik Tok, is expected to be the future of eCommerce in the upcoming years.
- Sales generated via Social commerce are expected to triple by 2025, with half of the buyers in China already engaged in social shopping. In 2022, Shopify estimated that 49% of brands would put effort into their content marketing for social media [33].
While little evidence shows there will be a significant rise in eCommerce digital currency usage in the upcoming years, some statistics reveal a positive outlook.
- Gartner, a world’s leading research company estimates that 20% of large companies will adopt digital currency by 2024 [34].
- According to blockchain.com, there are about 81 millions of mobile wallets for digital currencies by May 2022. [36]
Most smartphones nowadays have virtual assistants and Amazon’s Alexa smart speakers are becoming more popular. As a result, it’s no surprise many more people are using voice to search and buy products on mobile phone more often.
- 27% of people are using mobile voice search online[37]
- The most use cases for voice searches recorded are in the Asia Pacific and developed English-speaking countries [38].
- 3 out 4 mobile voice searches buy something on their phone in the previous month. [38]
- Among voice search users, “free delivery”, “Coupon and discounts”, and “easy returns policy” are top three triggers for them to buy online. [38]
The bottom line
The time for Mobile Commerce is now and it’s critical. Every day you’re not implementing the best approaches in your store is potentially thousands of dollars lost.
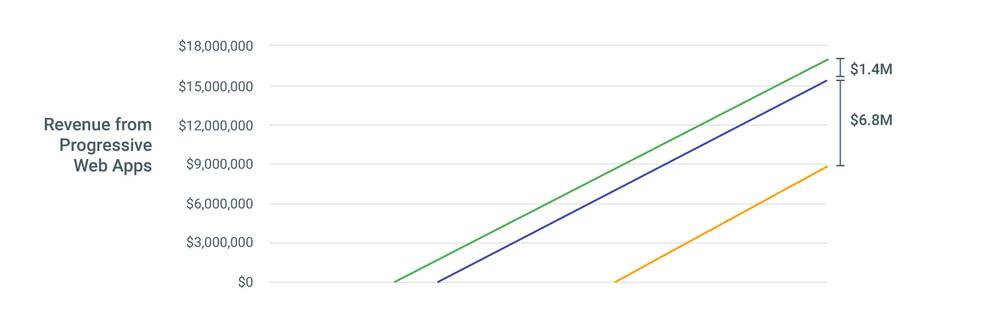
For instance, a retailer with annual revenue reaching up to $20 million could see a $1.4 million loss in revenue simply by delaying their implementation of Progressive Web Apps (PWAs) for 1 month, and another $6.8 million if they decided to delay it for six months. PWAs are essentially a free revenue boost to businesses, which is why it’s the current trend among eCommerce retailers to mass adopt PWAs into their business, making it the new go-to approach for developments of responsive, mobile-first online stores.
Recommended reading:
It is thus that you should always try to keep up with the industry and find out for yourself which current practices are the best and most suitable for your business. Your new initiatives, of course, should have statistical data in mind and not rely solely on a hunch.


