
Table of contents
What is eCommerce analytics?
Ecommerce analytics refers to the application of a tool or strategy to analyze data to produce useful insights.
Initial to any stage of planning is data analytics. According to MicroStrategy’s study, 52% of enterprises leverage advanced analytics data to provide greater insights. It also helps them implement better key strategic initiatives and improve relationships with customers and business partners.
The stage of analytics can make or break a business’s performance, and it’s important whether you’re running a brick-and-mortar or online business. The differences lie in the indicators and analytics tools.
We will go into details right now.
Key components for eCommerce analytics
There are three key components that a business looks at to measure web analytics performance:
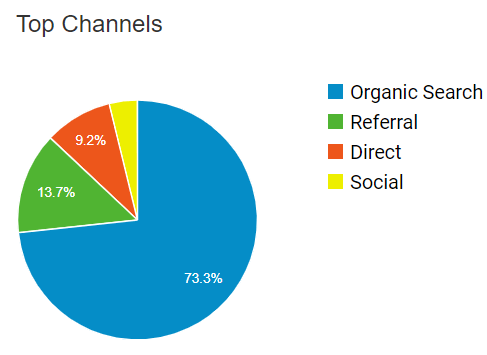
1. Channels
Channels include your website and its traffic sources, and your business’s social media.
All traffic can be divided into search, referral, campaign and direct.
– Search traffic comes directly from search engines such as Google, Bing and Yahoo.
– Referral traffic is traffic from a direct link on a different website.
– Campaign traffic is traffic from a dedicated campaign or a link with certain tracking parameters. For instance, if tagged as a Campaign, a marketer can see if traffic comes from Google Ads or other advertising sources.
– Direct traffic is counted when a visitor goes to a website by typing the URL or from undefined channels.
Social media
Besides tracking your website traffic, monitoring your social media is just as crucial. Marketing on social media brings tremendous benefits, and popular platforms like Facebook, Twitter and Linkedin also offer useful insights.
Analyzing data from these platforms can answer these questions:
– Is social media generating leads for your business?
– Which campaigns are effective?
– Does social media provide useful customer insights?
2. Customers
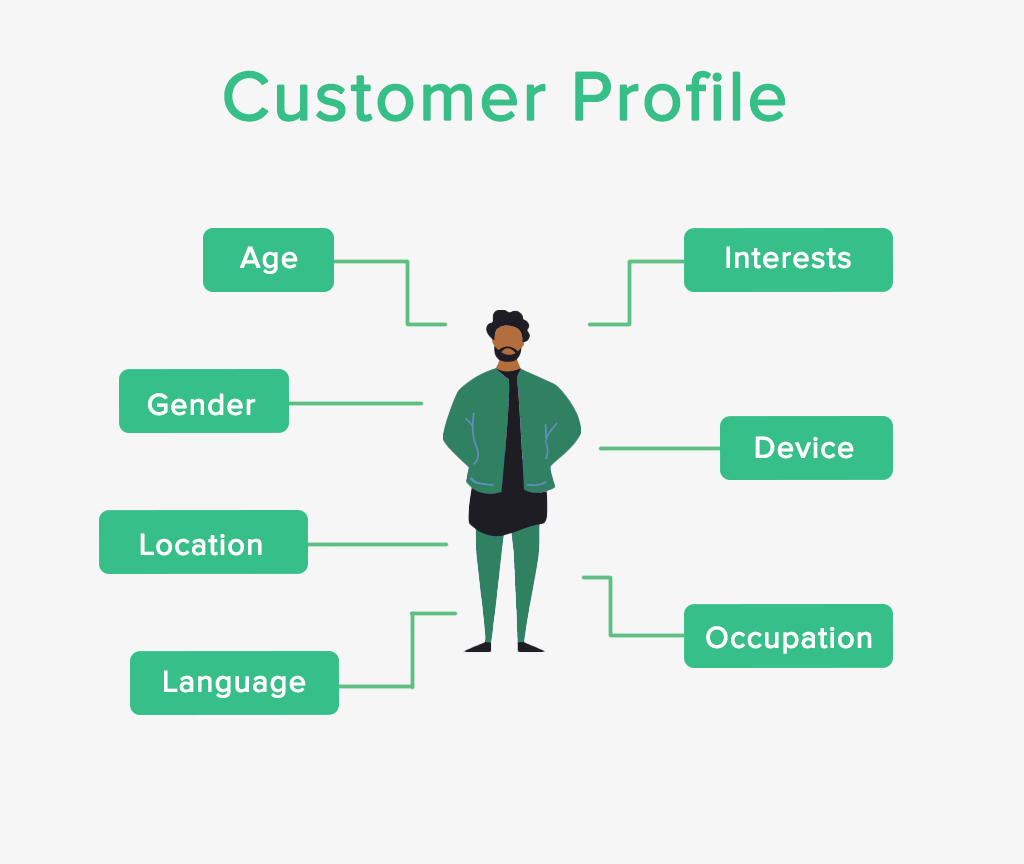
This component indicates your audience’s demographic details and their behavior on your website.
Audience demographics that can be collected through analytics tools include age, gender, location, occupation, interests and devices. If you’re using Google Analytics (or similar tools) for your business, you’d be more than familiar with these factors.
The behavior flow of a customer on your website is extremely important as it makes sense of what’s attractive for the person and what can make them abandon the cart. But it answers more questions than that:
– Are they leaving as quickly as they land on the page?
– Which section on the page do they linger at?
– Do they encounter any issues on the page?
– Which page has the highest traffic and which has the lowest?
– Which pages can generate more leads?
… and the list goes on.
3. Products
This component refers to product performance, conversions, revenue and the number of products sold.
Some key measurements related to products retail:
– How long does it take to convert a lead into a buyer?
– Do the conversions rise or fall during a specific date/month?
– Which channel brings more quality leads that can be converted into buyers?
– Top and worst sellers?
– What is the cost tier to converting these customers?
– Inventory turnover
By monitoring these metrics, you have a holistic view of your profits, identifying specific products and channels that generate profit. Besides, it helps to forecast upcoming changes (both positive and negative), allowing your business to make adjustments in time.
Benefits of eCommerce analytics
With eCommerce data analytics, businesses can find areas of opportunity, predict important trends, and gain efficiencies that can let them retain customers and lead to growth.
- Produce useful insights for business’s strategies
By analyzing data, you’d see what is happening in-store. For example, by looking at product data, it’s clear what qualities your customers care about the most. Then you can use this information to innovate future products.
Another example is that you want to expand your business to a new region. After analyzing data, you’d be able to decide the possibility and investment for expansion, and allocate the resources.
- Understand customers behavior
Do you know how customers navigate your website or at which step they usually left before making a purchase? Which parts of your website attract customers?
Knowing how the customer behaves gives tremendous help when designing your website for the best experience which would make them come back. It comes from the simplest things like where the CTA button should be placed, or images or text would be more suitable for a specific page section, …
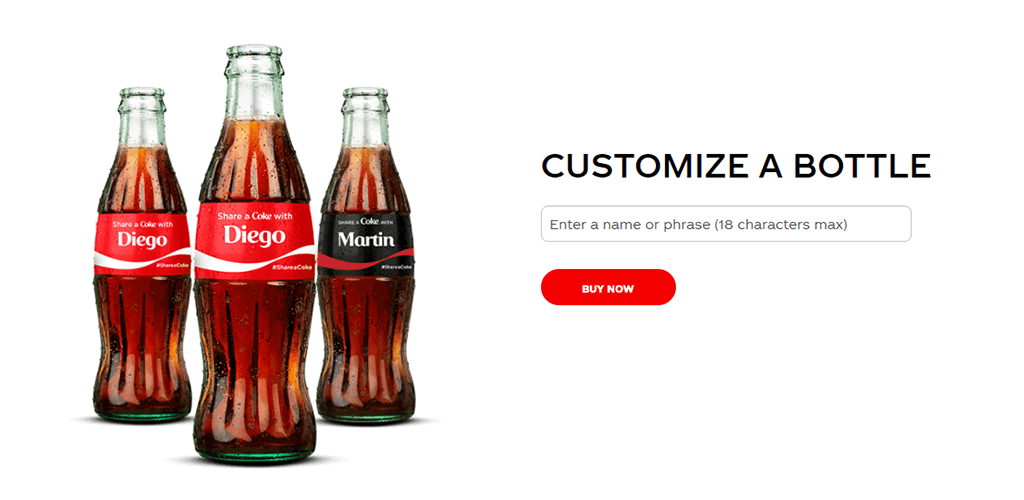
- Personalize customer experience
By looking at customer demographics, you’d know your target customer better and be clear on what to offer them. People in different age groups have interests in different product categories, or if a product is sold more in a certain region, … all of these can be analyzed for valuable insights.
Then you can work on offering a personalized experience for marketing sales. Delivering the right promotions to your customers will raise their interest and result in more conversions.
- Evaluate marketing efforts
Marketing is great, but only when resources are effectively allocated. Collected data helps to evaluate how impactful your marketing strategy or campaign was, if it’s targeting the right segmentation, which channels/campaigns can generate more leads, are people looking at the product you want them to buy,…
By learning from previous campaigns and data, the next marketing strategies can be improved to drive more sales and expand the business.
- Optimize pricing
Pricing is an important factor that impacts a person’s purchase decision. Your pricing strategy can set you apart and attract customers when done right. With analytics tools, you get insights into the upcoming changes, thus determining the optimum price for a product to maximize profit.
For example, when it’s almost time for the summer holiday, sales for items like sunglasses or sunscreen increase and they are shown on reports, you may raise the prices accordingly to maximize profits.
- Forecast
Ecommerce analytics tools provide important forecasts for how your business will likely perform in the future from the available data. The forecasts can cover almost any aspects from sales, customers, operation costs to product inventory.
Tips for tracking your eCommerce performance
- Monitor regularly
This advice sounds obvious, but many businesses are not doing enough monitoring. After getting your analytics tools set up, it’s better to check the data regularly. Depending on the kind of data, the frequency can be daily, weekly or monthly.
- Set goals
With tools like Google Analytics, you can set goals for better data tracking like “click to main site”, “purchase product”, or “leads”. This will also let the analytics tools produce more useful reports to match your business demands.
- Investigate consumer journey
Crazy Egg or Hotjar are popular tools that help understanding how a customer interacts with your website. By understanding the customer journey, your online store can be optimized for purchases.

- Set up custom alerts
Website errors impact customer experience negatively, and that’s not good for your online store. So we suggest setting up custom alerts for cases like server or link errors.
- A/B testing
To decide which strategies work for your business and customers, A/B testing is a great option. You can opt for small changes like reallocating a few elements on your websites or switching promoted products, … These changes may improve your content, drive higher conversion rates, and improve user engagement.
- Make the most out of your eCommerce platform
Your eCommerce platform often comes with useful analytics tools, such as Magento BI, Shopify Analytics or Bigcommerce Analytics. However, these analytics tools are sometimes overlooked by businesses, but they are just as strong as other third-party tools.
The data is generated directly from your store, and the reports are updated on time. These platforms can provide diverse reports to cover aspects of your eCommerce business.
Final thoughts
Incorporating eCommerce analytics into your business process takes time and effort, but the results will no doubt pay off if it’s done correctly. It’s not always simple with all the tool integration and learning and analyzing stages that follow.
To start off, we would recommend some tools like Google Analytics, KISSmetrics, Optimizely, Crazy Egg, … These tools provide more than enough for beginners, and you can advance your game with them as time passes.


